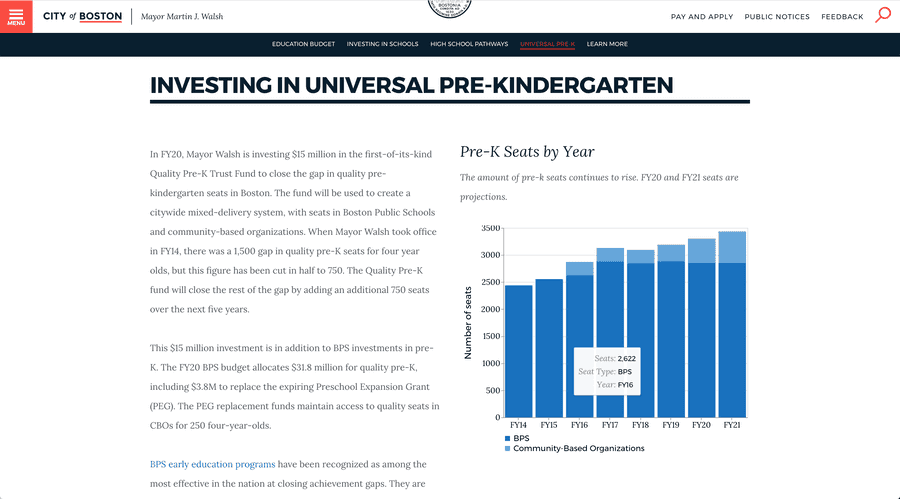
Charts on boston.gov.
Developer and Product Manager
Project Overview
Each year, the City of Boston's Budget Department writes the Budget Book that outlines and describes the next fiscal year's budget and allocates resources across departments and programs.
For FY2020, I worked with the Budget Department to integrate relevant information about the City's new budget into boston.gov. We:
- restructured the Fiscal Year Budget content
- brought down the reading level of the content to at or near 8th grade bringing it inline with our site writing guidlines
- added three new open datasets to the City's open data portal
- built out interactive charting component for use throughout boston.gov.
Tech
In addition to project managing the content side of this project, I also product managed and developed the interative charting component we created for it.
The charts component on boston.gov is implemented similarly to our maps component, as a web-component we drop on a boston.gov page when needed.
The charts leverage the Vega and VegaLite libaries for rendering. Users supply valid Vega/VegaLite json to the components config prop, we then maniuplate the passed spec and rendered chart to fit our needs on boston.gov and display it on the page.
The code for the charts is on github.
